Drivers of Change investigates the key global issues and trends driving change in our societies and markets. Drivers of Change 2.0 is a 2015–17 research project that extends and updates original card series.
Roles & Responsibilities:
Visual redesign of cards, digital, and interactive assets
Content development and collaboration on new drivers and research areas
Project management of global team: New York, London, Berlin, and San Francisco
Direct report to Global Director and Associate Director on program status
Engagement with Global Marketing and Communications on project delivery
QA and design management of localized cards in other languages
Collaboration with Australian Ocean Explorer Tim Jarvis, project mentioned in Arup’s 2019 Annual Report
Collaboration with San Francisco’s Climate Music Project

Exploration and Feedback
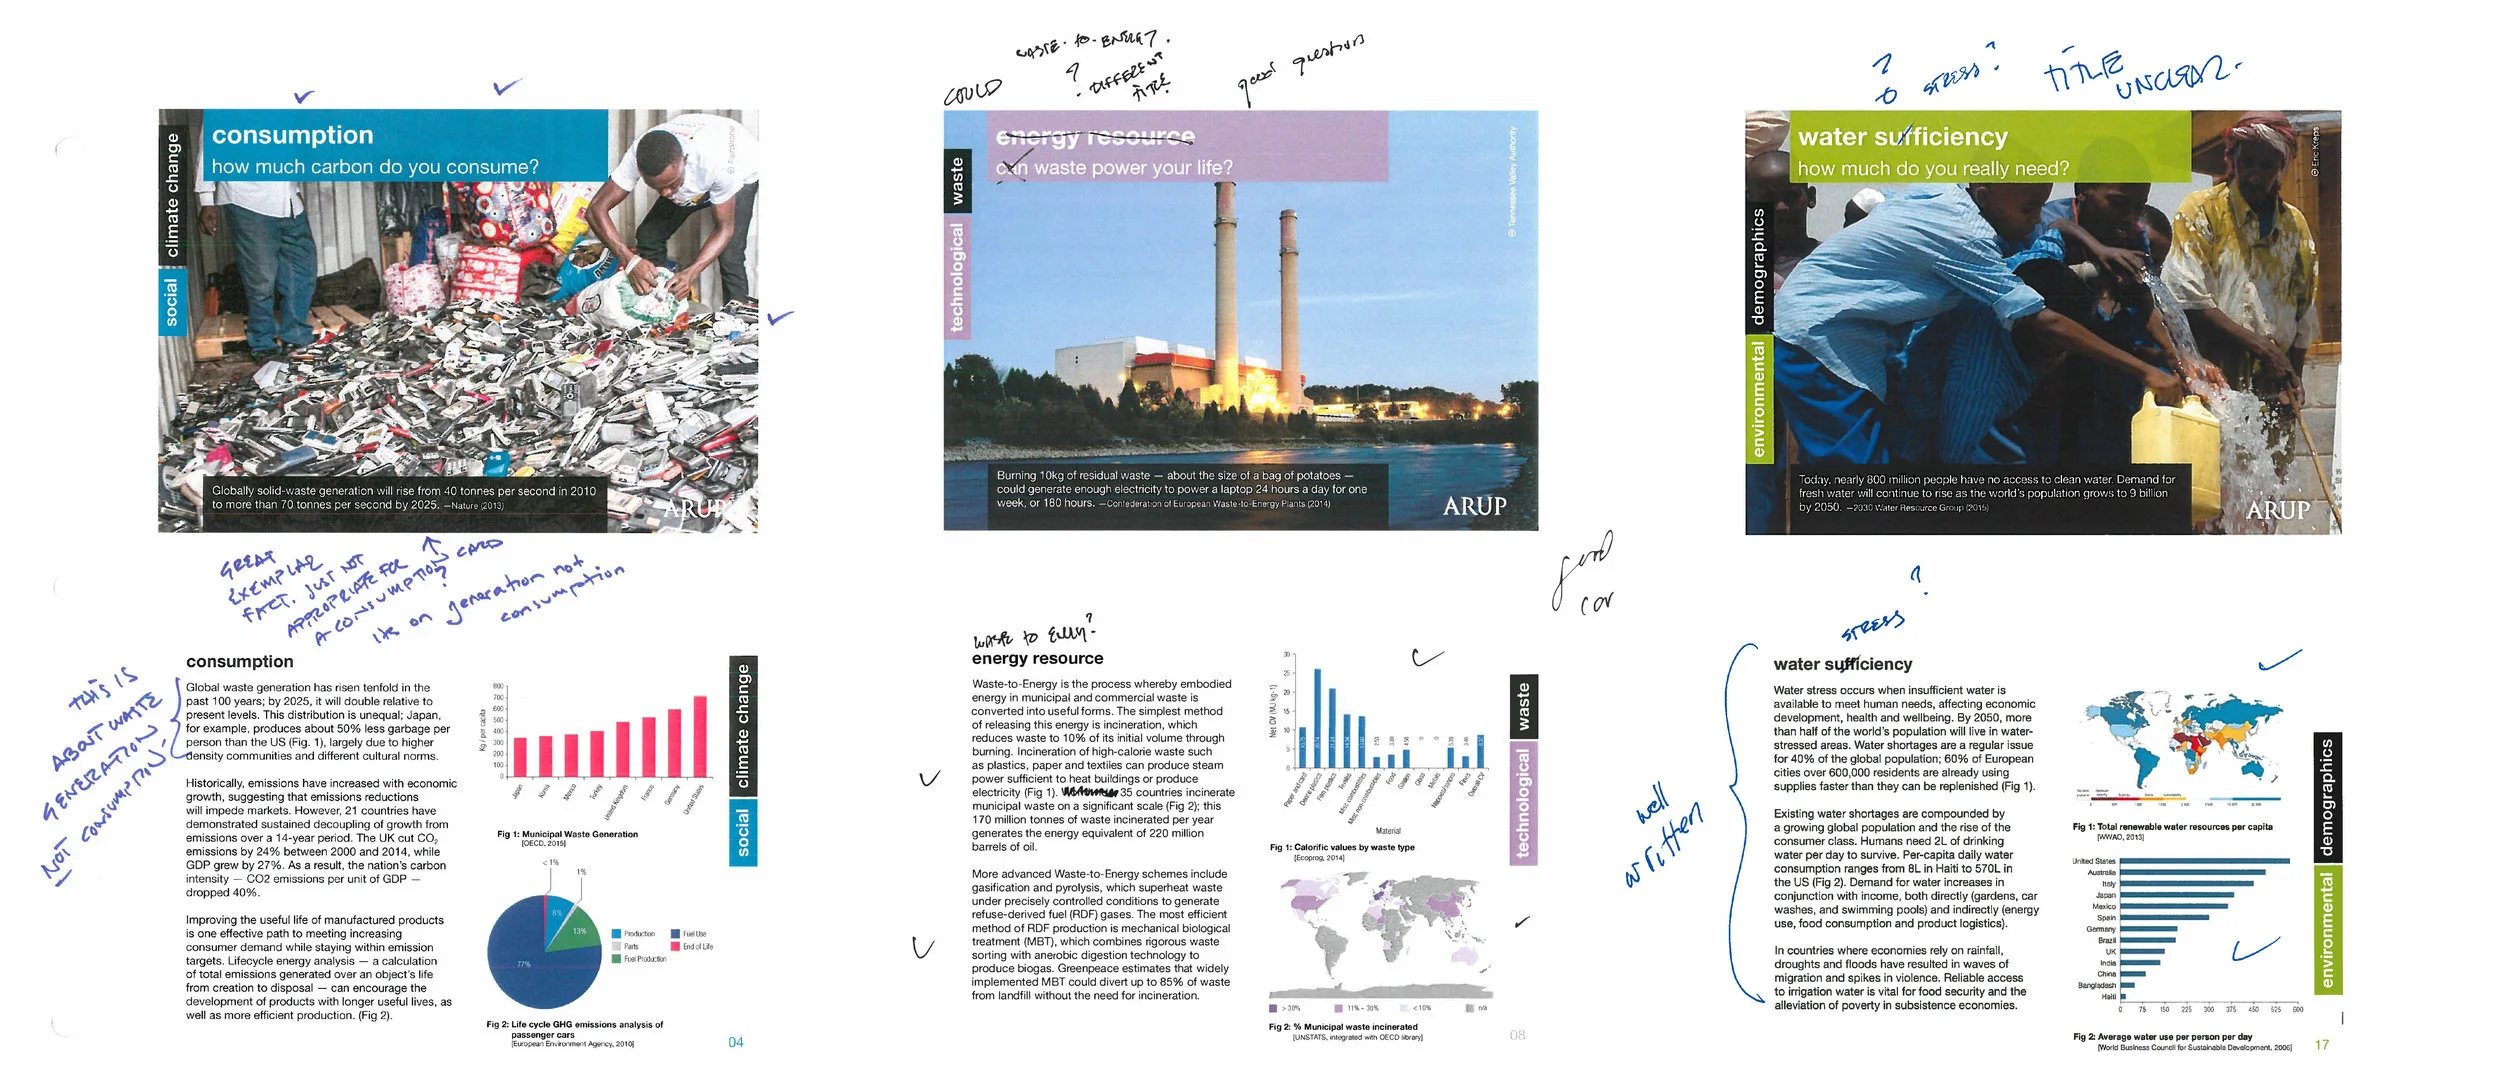
As part of the 2.0 research and design phase there was a need to be able to visually show the existing content and capture feedback simultaneously. The feedback template was sent to internal stakeholders across global businesses. Each element of the card was evaluated to its current relevancy and was used as a decision making tool as well as a roadmap to new and existing drivers.
Roles & Responsibilities:
Development of conceptual framework for feedback and review
Worked to identify internal stakeholders for document review
Analysis of feedback and insights
Developed recommendations for new trends / issues


IXD PDF Deliverable
The Drivers of Change is a unique physical tool for workshops and brainstorm discussions. As a way to steer towards the digital world I created a interactive PDF version using existing Arup design patterns. This increased the global reach of the program and also became a precursor to the mobile app.


Drivers of change 2.0 Research & Development
The redesign of the cards worked in parallel with the research of 2.0 material for Water and Energy. One insight that was most common in the feedback review was the uncertainty of what the "driver" was as opposed to the question. This lead to a restructuring of the information hierarchy on the front of the cards.
As part of a global effort I managed the incoming research, evaluated its quality, and reported progress to the Global Director. Each topic (Water, Energy, Waste, Demographics, Climate Change, and Urbanization) was given to a specific research team spanning offices from San Francisco, New York, London, and Berlin. As a result the content quality and tone of voice was varied. This lead to a creation of a small localized team in SF that I lead to ensure consistency in research, writing, and visual content.
To assess feedback and define tasks we used Microsoft Excel as a project dashboard. This allowed myself and other project owners a snapshot of progress and completion rates. It allowed us to capture feedback from multiple sources and to divide tasks among research, editorial and design. Feedback came from various sources — handwritten notes, comments in PDFs, in person reviews. All of this was captured in our project dashboard.
Roles & Responsibilities:
Lead visual redesign with feedback from Foresight London team and Global Director
Audit of incoming research and visual assets
Assembly and management of local research and editorial team in SF
Asset management of cloud-based research documents and productivity tools
Analysis and documentation of feedback
Facilitated team meetings to discuss potential roadblocks and progress
Collaborated with editorial and content strategists on new drivers, questions and research
Maintained open communication with team
In-progress and final reviews with Global Director